Bench weighing · Instrumentation
Load-cell measurement chain
A load-cell measurement chain with calibration fitting, an uncertainty budget, and digital filtering. The supplied measurements are synthetic and reproducible.
Calibration and filter analysis executed
Implementation
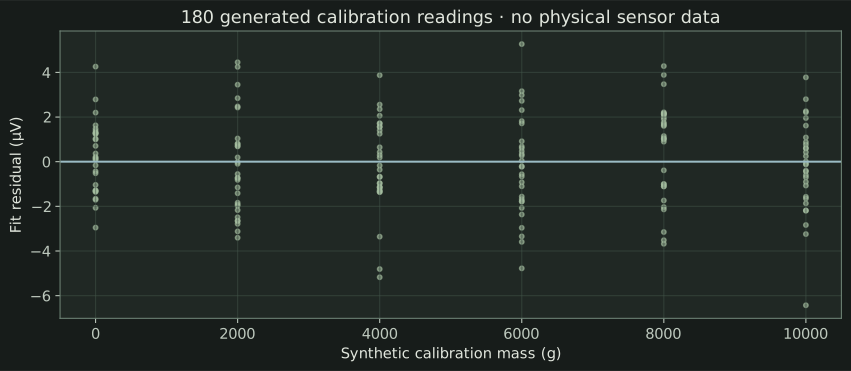
Seeded six-point calibration with slope/intercept covariance
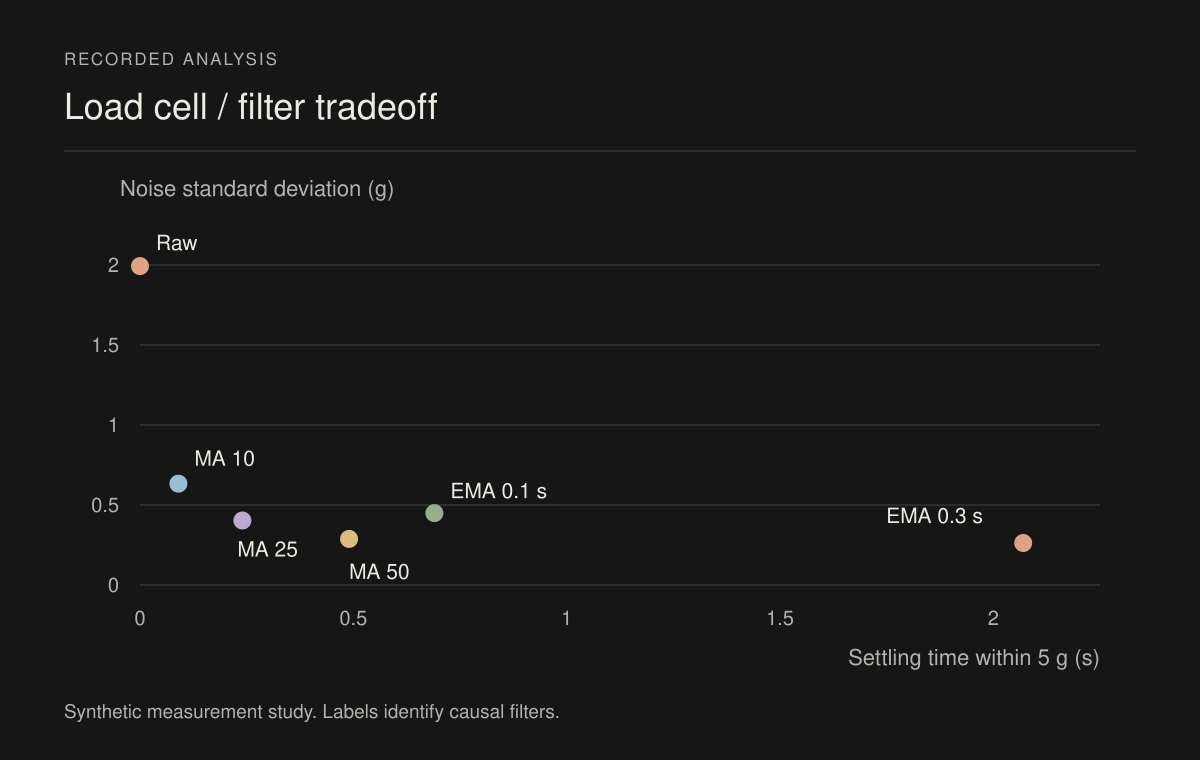
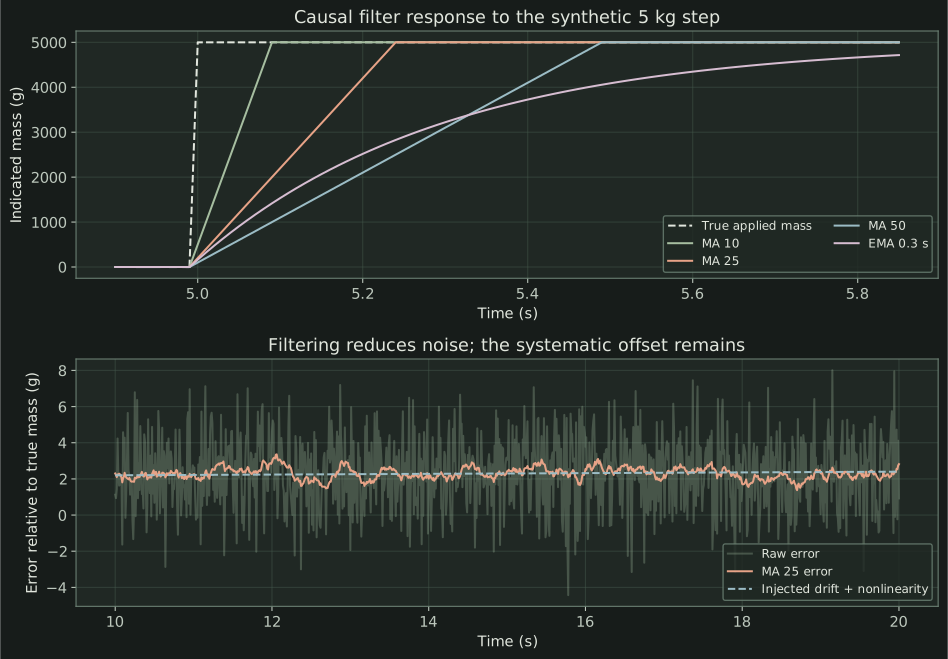
Six causal filter variants, step settling, systematic drift and uncertainty budget
Optional explicitly gated zero tracker with sustained-load tests
Executed synthetic/theoretical validation with a selected operating envelope, adverse conditions, and reproducible acceptance evidence.
Inputs and assumptions
- 10 kg bridge, 2 mV/V sensitivity, 5 V excitation; reference 24-bit ADC with 2.5 V reference and gain 128
- 100 Hz acquisition; 2 µV RMS independent white noise; positive 0.02 g/s drift; every trace and calibration sample is synthetic
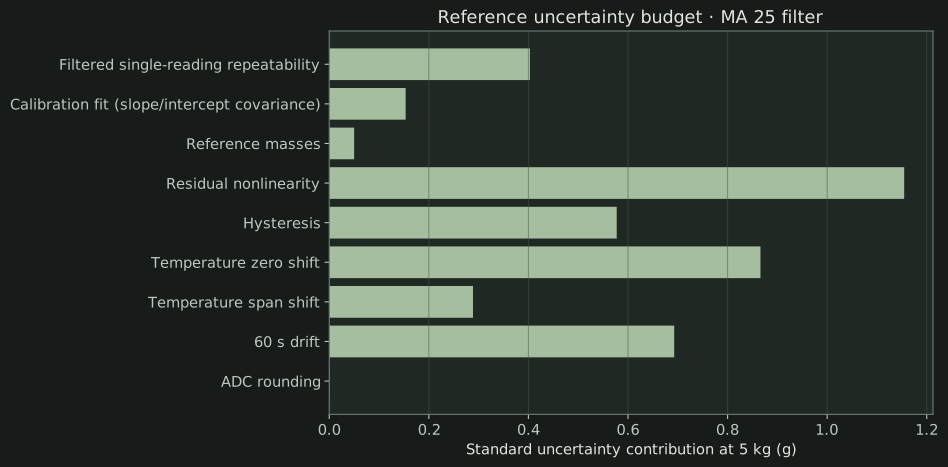
- Residual nonlinearity ±2 g, hysteresis ±1 g, temperature-zero ±1.5 g, temperature-span ±0.01% of reading over 10 °C; these are assumed uncertainty bounds
Results
| Filtered white-noise standard deviation | 0.403 g |
|---|---|
| 5 kg step settling within 5 g | 0.24 s |
| Independent-temperature budget at 5 kg, k = 2 | 3.56 g |
| Virtual validation checks | 12 / 12 |
| Thermal/load/direction corners | 24 |
| Correlated standard uncertainty at 5 kg | 1.913 g |
| Shared-temperature study at 5 kg, k = 2 | 3.826 g |
Report figures (4)
Verification
18 tests; exact calibration, Monte Carlo covariance, causal filters, analytic settling and drift preservation. Additional virtual validation: 12 checks matched their expected outcomes. Adverse design conditions remain in the results.
python run.pyAdditional scenarios
12 outcomes checked through synthetic/theoretical. The report lists the expected and observed outcomes for each check.
Read the validation report ↗Project files
The ZIP contains the source, inputs, results, and instructions. These files are also available individually.
- Analysis reportreport.html · 9 KB
- Calibration, filters and zero trackermeasurement.py · 5 KB
- Reference and synthetic-data inputsinputs.json · 1 KB
- Generated calibration readingsdata/synthetic_calibration.csv · 13 KB
- Uncertainty budgetresults/uncertainty_budget.csv · 1 KB
- Filter comparisonresults/filter_comparison.csv · 1 KB
- Verification casestest_measurement.py · 4 KB
- Unexecuted physical calibration procedurephysical_calibration.md · 2 KB
- Virtual validation reportvirtual-validation.html · 12 KB
- Completion evidence and source hashescompletion.json · 6 KB
- Reproducible virtual validationvirtual_commissioning.py · 15 KB
- Executed acceptance matrixresults/virtual-acceptance.csv · 2 KB
- Selected measurement envelopeselected-operating-envelope.json · 1 KB
- 16 verified selected-envelope cornersresults/virtual-selected-envelope.csv · 1 KB
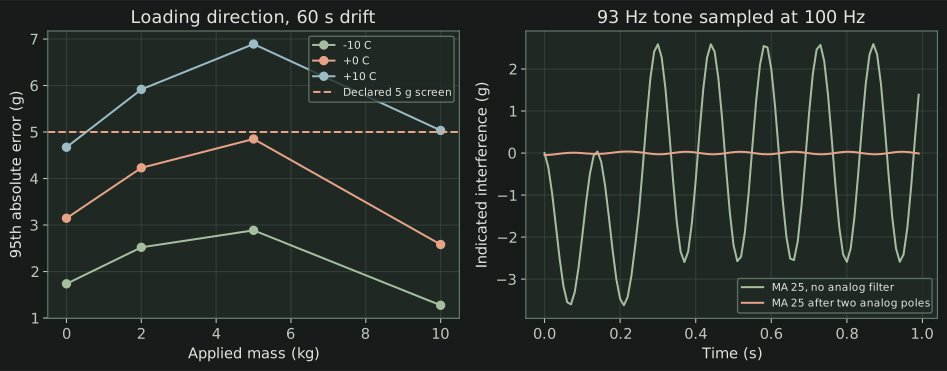
- Thermal screening and synthetic interference after samplingfigures/virtual-instrument.svg · 39 KB
- All 24 temperature/load cornersresults/virtual-temperature-corners.csv · 2 KB
- Calibration contamination casesresults/virtual-calibration-rejection.csv · 1 KB
- Correlated uncertainty calculationresults/virtual-correlated-uncertainty.json · 1 KB
- Analog filtering and aliasingresults/virtual-aliasing-summary.csv · 1 KB
- Synthetic interference traceresults/virtual-aliasing-trace.csv · 34 KB
Archive checksum
SHA-256
516c98eb0b1e0bdb3dea88a6b01ebe410f2c2ec33c7dcd28e8cb27f905d60178Original project scope
Archived brief PDF ↗Run locally
Python 3.11+ / NumPy / Matplotlib
Extract the ZIP and open a terminal in the load-cell-measurement folder. The README includes setup and usage details.
python -m pip install -r requirements.txt
python run.py
python -m unittest -v
Limits
- No physical bridge, ADC board or calibration masses were measured. These results validate the analysis code under stated synthetic conditions.
- Differential ADC headroom is calculated; common-mode input range, excitation/reference tracking, analog anti-alias filtering, EMI, mounting and overload survival need actual component and installation checks.
- The baseline budget assumes independent components except for fitted slope/intercept covariance. The separate virtual-validation report also evaluates shared temperature error; its expanded uncertainty is higher.
- k = 2 is an illustrative expanded uncertainty, not a certified 95% coverage claim. The Type B bounds must be replaced by evidence before using the budget for acceptance.
- Zero tracking is disabled in the reported measurements. The optional tracker requires external empty-pan confirmation; it cannot distinguish drift from a small real load if that confirmation is wrong.